Lab2 C Debugging(除了ex7其余完全完成)
Exercise 1: Compiler Warnings and Errors

编译之后报错,我们按照错误的位置寻找并且修改错误就可以,完成ex1.
What is GDB?
一个调试工具
GDB can do four main kinds of things (plus other things in support of these) to help you catch bugs in the act:
- Start your program, specifying anything that might affect its behavior.
- Make your program stop on specified conditions.
- Examine what has happened, when your program has stopped.
- Change things in your program, so you can experiment with correcting the effects of one bug and go on to learn about another.
Exercise 2: Intro to GDB
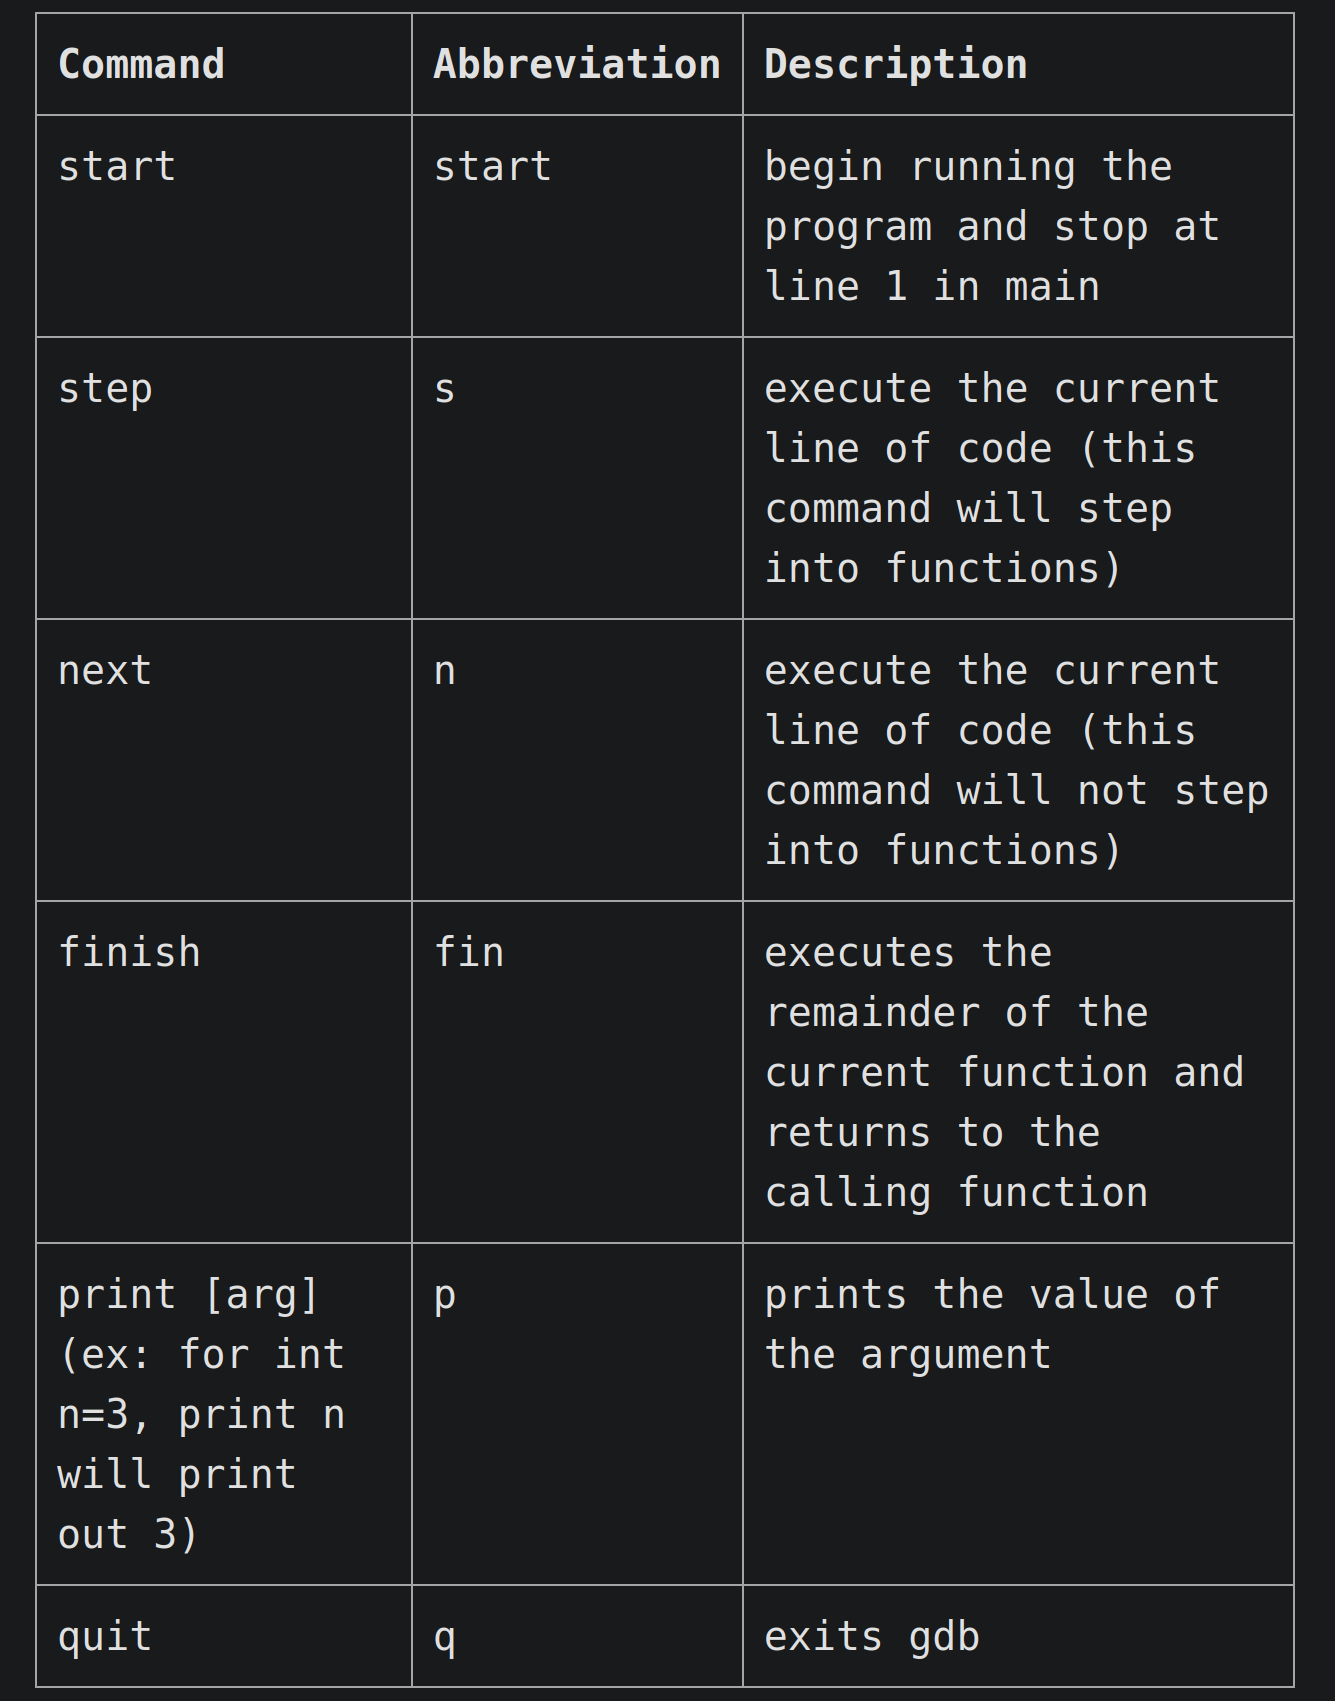
首先我们给出调试命令
注意下面的-g非常重要,否则将进入汇编级别的代码调试
-g 是编译器(如 GCC 或 Clang)的一个编译选项,用于在编译时生成调试信息(debugging information)。具体来说,-g 选项会让编译器在生成可执行文件的同时,将源代码级别的信息(如变量名、行号、函数等)嵌入到可执行文件中,这样在使用调试器(如 GDB)进行调试时,调试器可以展示源代码而不是仅仅展示汇编代码。
gcc -g -o pwd_checker test_pwd_checker.c pwd_checker.c
使用命令
cgbd pwd_checker
xxx是程序名字。
进入调试界面,按照上面的表格进行调试,先start.
注意step和next的区别
Exercise 3 Exercise 4: More GDB
更多的命令
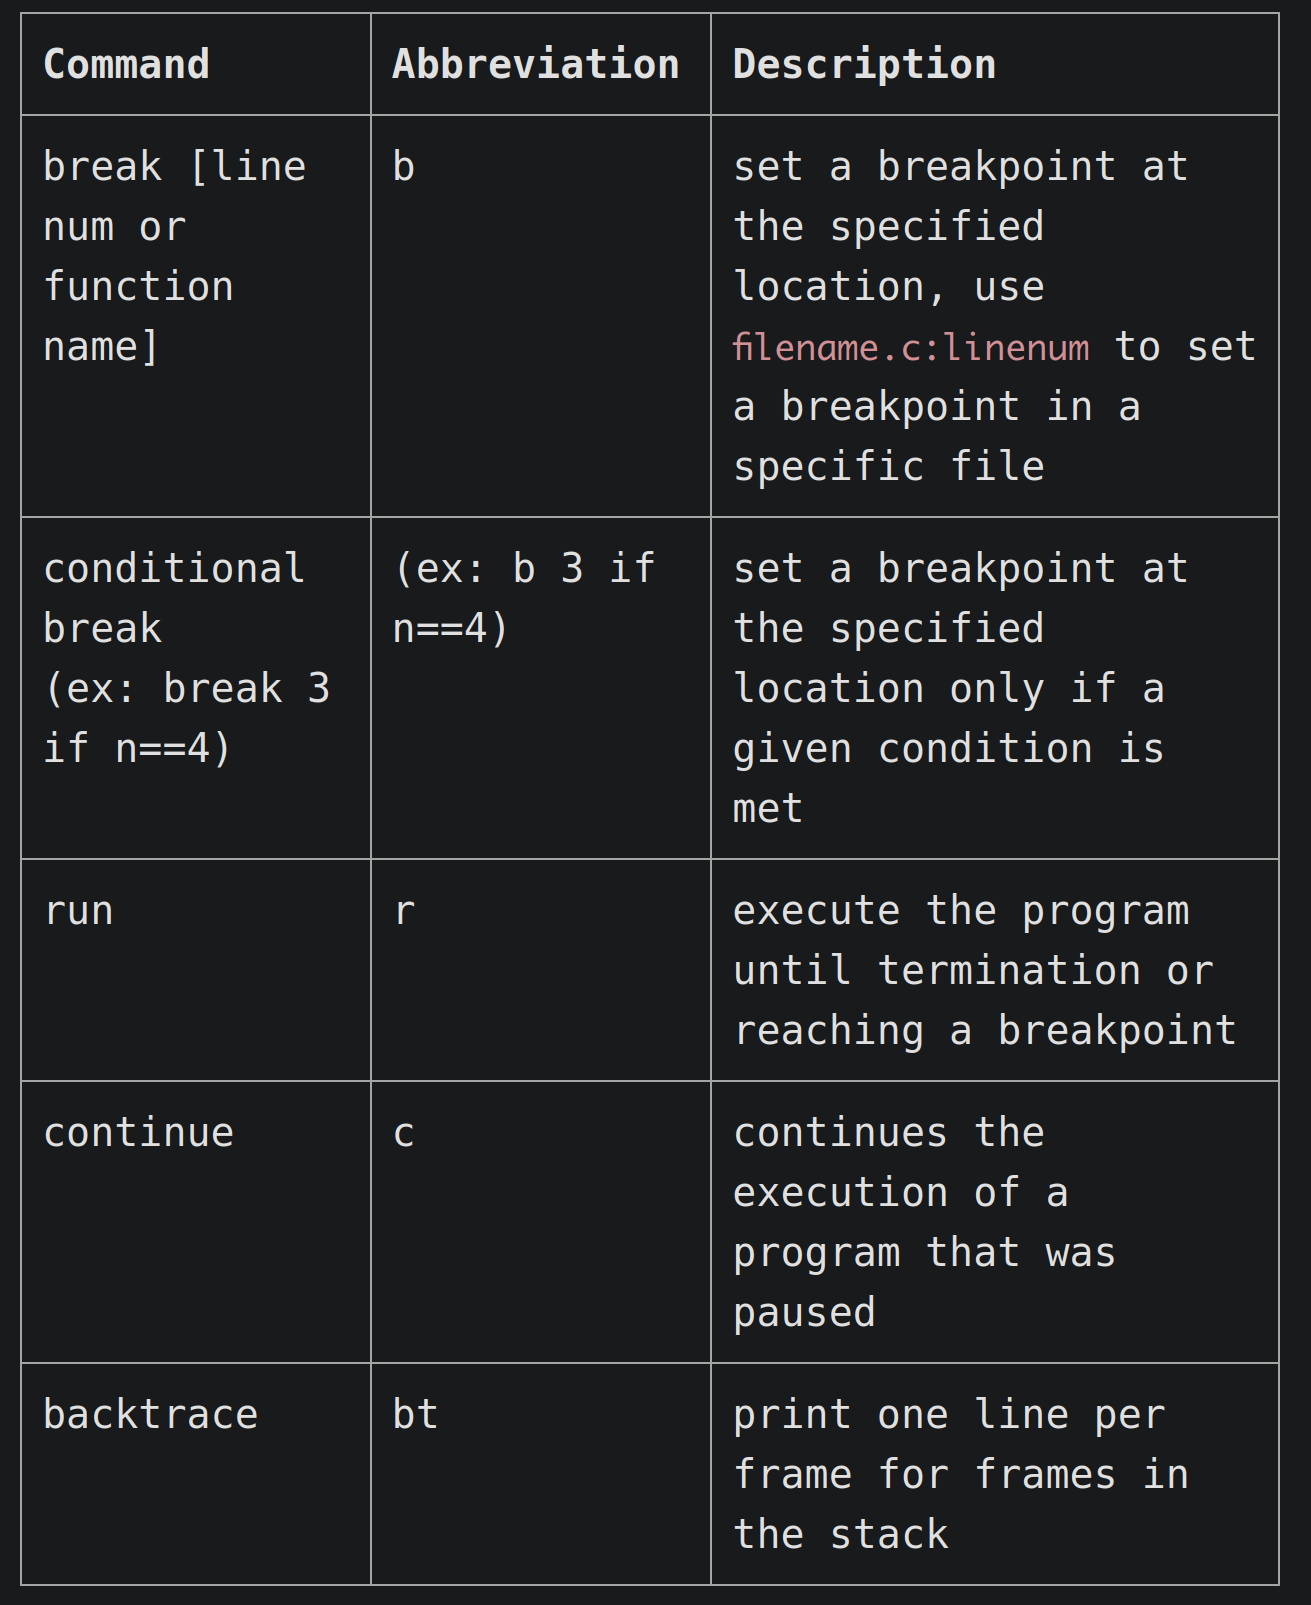
这里就是带我们又修复了两个bug
1.是0和‘0’
一个是0和‘0’,他们比较的时候出现了问题

在这里传输成了数字不是char类型。
2.=号
再一个是这里的=号,这里开始的时候,没有等于号,这意味着边界的判断有问题

最后我们看到

完成
Exercise 5: Debugging Segfaults
- Read the output carefully, and answer the following questions in
ex5_answers.txt. Please don't change the formatting of the file.- What function did the segfault happen in? (The answer should the name of a function)
- What line number caused the segfault? (The answer should be a single number without any units)
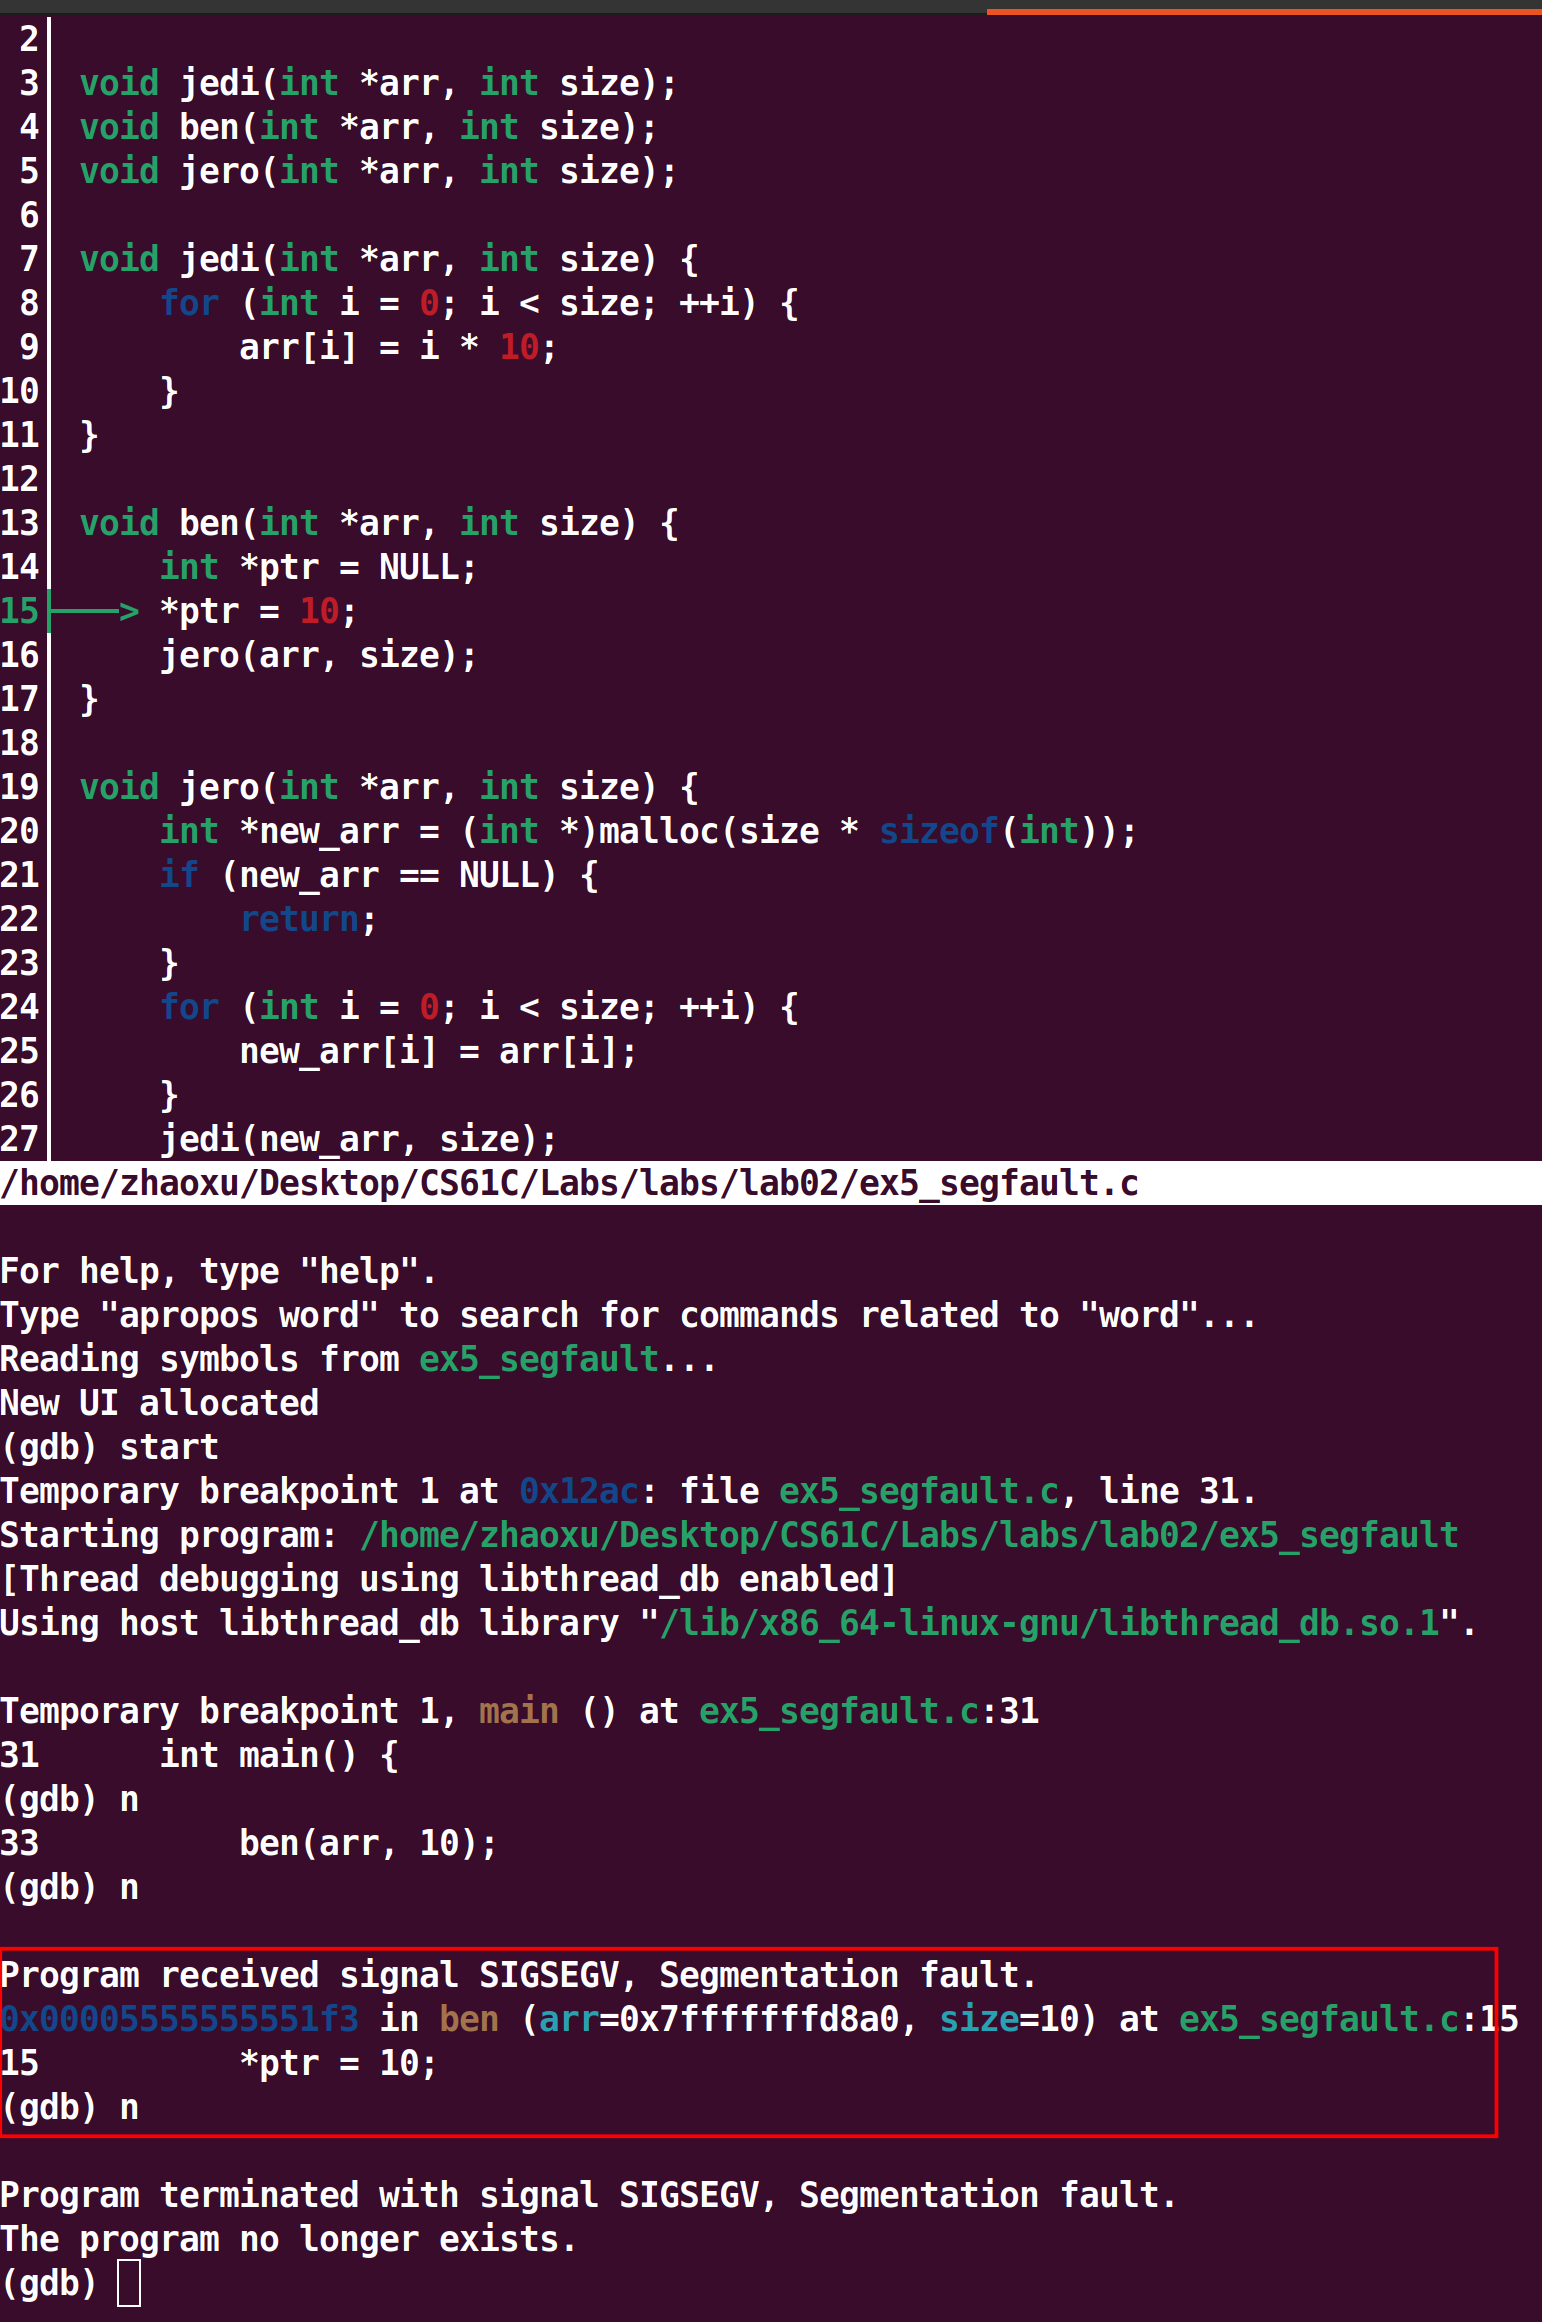
1.ben
2.15
Valgrind
为什么使用Valgrind
Even with a debugger, we might not be able to catch all bugs. Some bugs are what we refer to as "bohrbugs", meaning they manifest reliably under a well-defined, but possibly unknown, set of conditions. Other bugs are what we call "heisenbugs", and instead of being determinant, they're known to disappear or alter their behavior when one attempts to study them. We can detect the first kind with debuggers, but the second kind may slip under our radar because they're (at least in C) often due to mis-managed memory. Remember that unlike other programming languages, C requires you (the programmer) to manually manage your memory.
海森堡bug(heisenbug,是用德国物理学家、量子力学的创始人维尔纳·海森堡的名字命名)是指在尝试研究它时似乎会消失或者改变行为的bug(程序错误)。
玻尔bug(bohrbug,用丹麦著名物理学家、诺贝尔获得者尼尔斯·波尔的名字命名)是海森堡bug的一个反义词,它指良好、稳固的bug。就像确定性的玻尔模型一样,它们不改变自己的行为,并且相对容易被检测到。
曼德博bug(mandelbug,名字取自本华·曼德博的曼德博集合)是原因极其复杂而很难修复的bug,其行为看上去混乱甚至存在不确定性。它也指程序员检查代码、修复它们时会发现更多bug的bug。
薛定谔bug(schrödinbug,名字取自埃尔温·薛定谔及他的薛定谔猫)是程序员发现一个永远不应该被触发的情况发生的bug。
兴登堡bug(hindenbug,名字取自兴登堡号空难)是具有灾难性行为的bug。
什么是Valgrind
Valgrind is a program which emulates your CPU and tracks your memory accesses. This slows down the process you're running (which is why we don't, for example, always run all executables inside Valgrind) but also can expose bugs that may only display visible incorrect behavior under a unique set of circumstances.
使用valgrind
后面是具体的程序。
valgrind ./bork hello
具体分析
==10170== Invalid read of size 1
==10170==    at 0x4C34D04: strlen (in /usr/lib/valgrind/vgpreload_memcheck-amd64-linux.so)
==10170==    by 0x10879F: make_Str (bork.c:22)
==10170==    by 0x108978: translate_to_bork (bork.c:56)
==10170==    by 0x1089F2: main (bork.c:68)
cs61c上的分析如下,我认为很好。
The error message states that we are doing an invalid read of size 1. What does this mean? An invalid read means that your program is reading memory at a place that it shouldn't be (this can cause a segfault, but not always). Size 1 means that we were attempting to read 1 byte.
碰到大型代码错误我们 basically work our way through the call stack that valgrind provides.
接下来有很复杂的分析流程,我不能写得比lab2更好了,直接点击链接。
Exercise 6: Using Valgrind to find segfaults
这个官网没提供,没办法写。
Exercise 7: Memory Management(先完成于老师的再回来/此处跳过24.9.24)
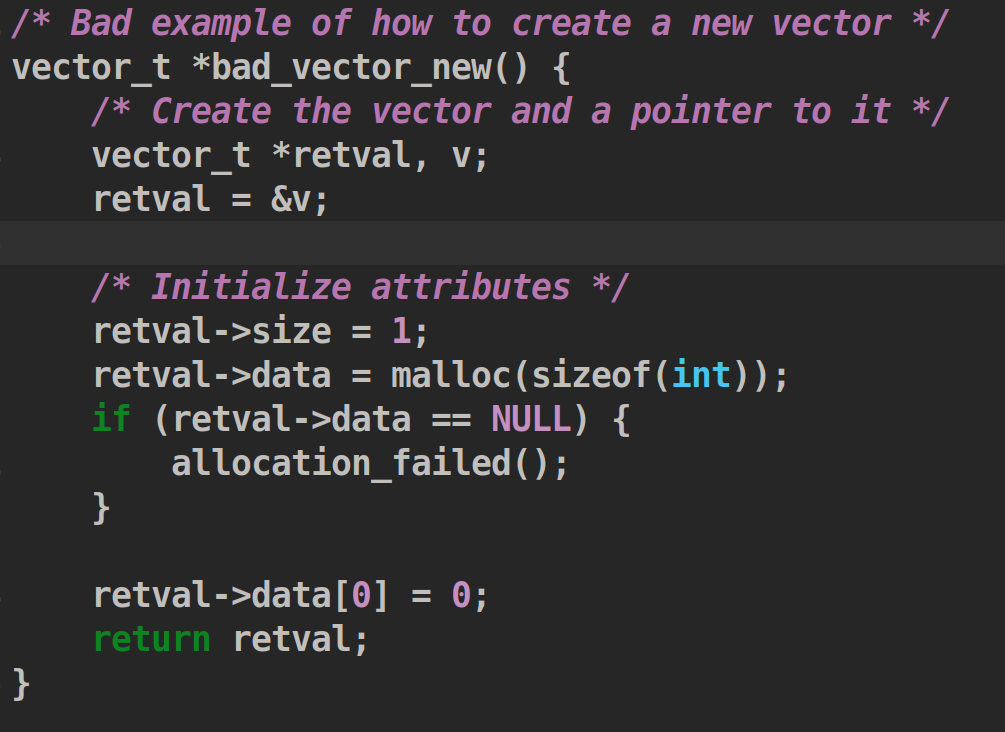
1.Try to explain why bad_vector_new() is bad. We have provided the reason here, so you can verify your understanding
The vector is created on the stack, instead of the heap. All memory stored on the stack gets freed as soon as that function finishes running, so when the function returns, we lose the vector we constructed.
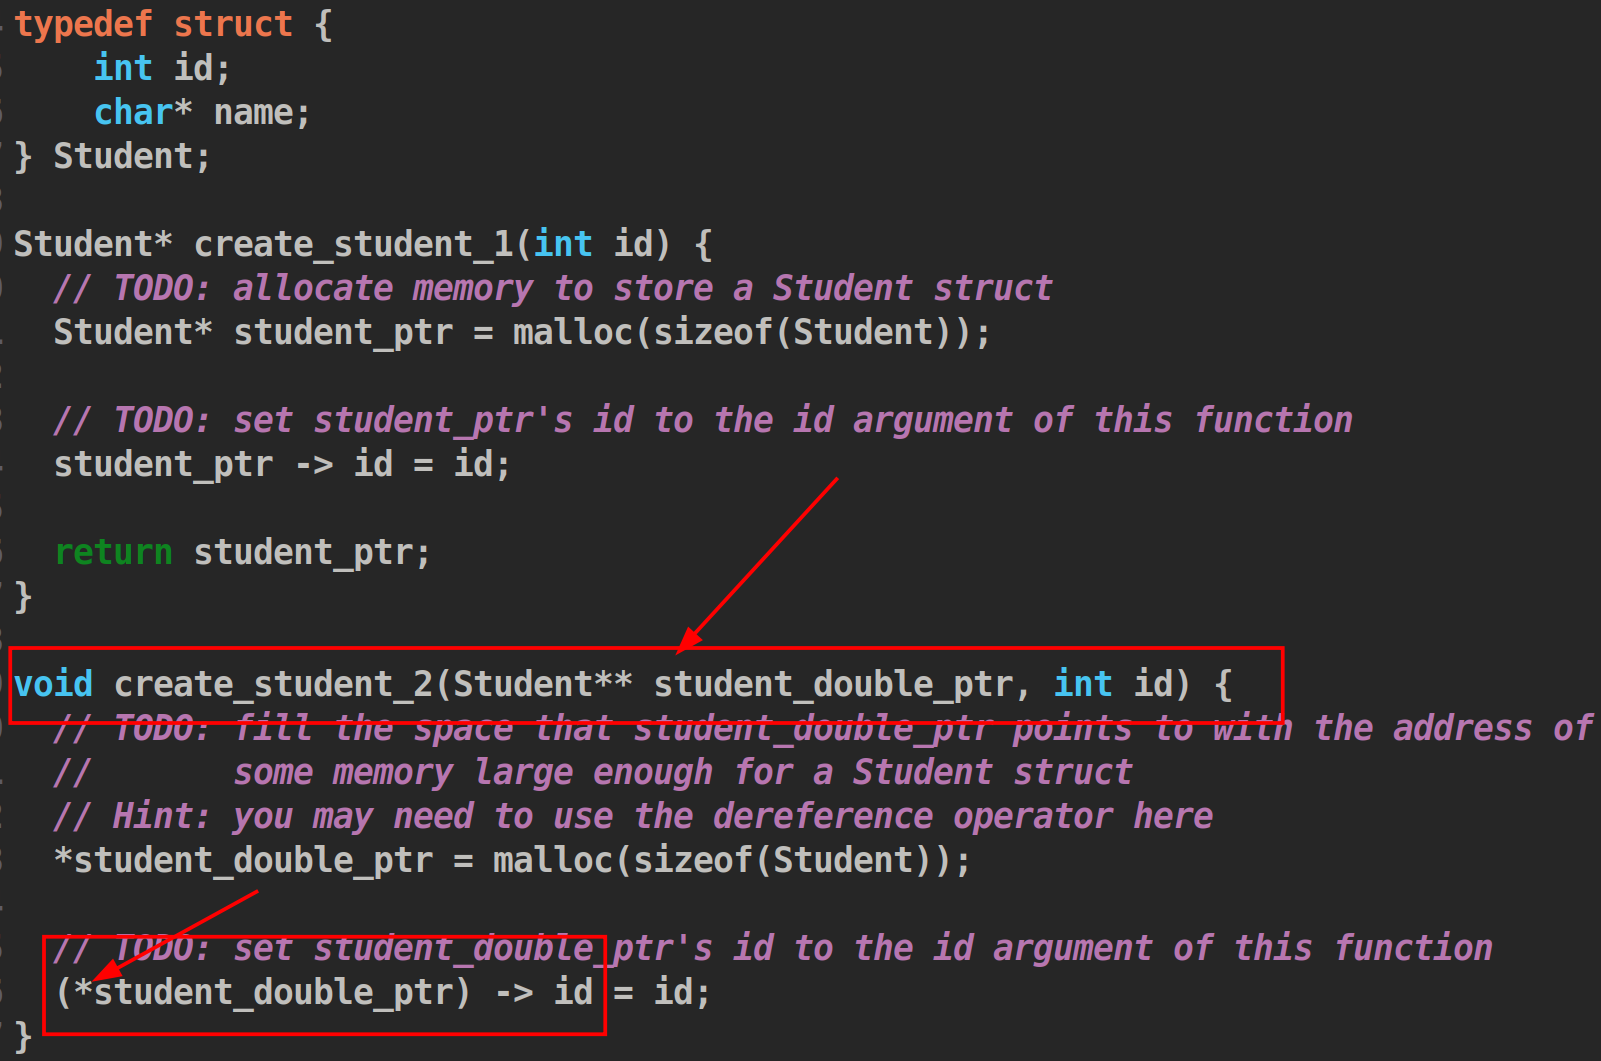
Exercise 8: Double Pointers
这个介绍了双重指针,就是指向指针的指针,练习很容易。
需要注意的是,一个指向结构的指针访问元素的时候要用->,同时double pointer要(*doublepointer)->
Common GDB Errors
GDB is skipping over lines of code
This could mean that your source file is more recent than your executable. Exit GDB, recompile your code with the -g flag, and restart gdb.
GDB isn't loading my file
You might see an error like this "not in executable format: file format not recognized" or "No symbol table loaded. Use the "file" command."
This means that you called gdb on the source file (the one ending in .c) instead of the executable. Exit GDB and make sure that you call it with the executable.
How do I switch between the code window and the console?
CGDB presents a vim-like navigation interface: Press i on your keyboard to switch from the code window to the console. Press Esc to switch from the console to the code window.
GDB presents a readline/emacs-like navigation interface: Press Ctrl + X then O to switch between windows.
I'm stuck in the code window
Press i on your keyboard. This should get you back to the console.
The text UI is garbled
Refresh the GDB text UI by pressing Ctrl + l.
Other Useful GDB Commands (Recommended)
Command: info locals
Prints the value of all of the local variables in the current stack frame
Command: command
Executes a list of commands every time a break point is reached. For example:
Set a breakpoint:
b 73
Type commands followed by the breakpoint number:
commands 1
Type the list of commands that you want to execute separated by a new line. After your list of commands, type end and hit Enter.
p var1
p var2
end